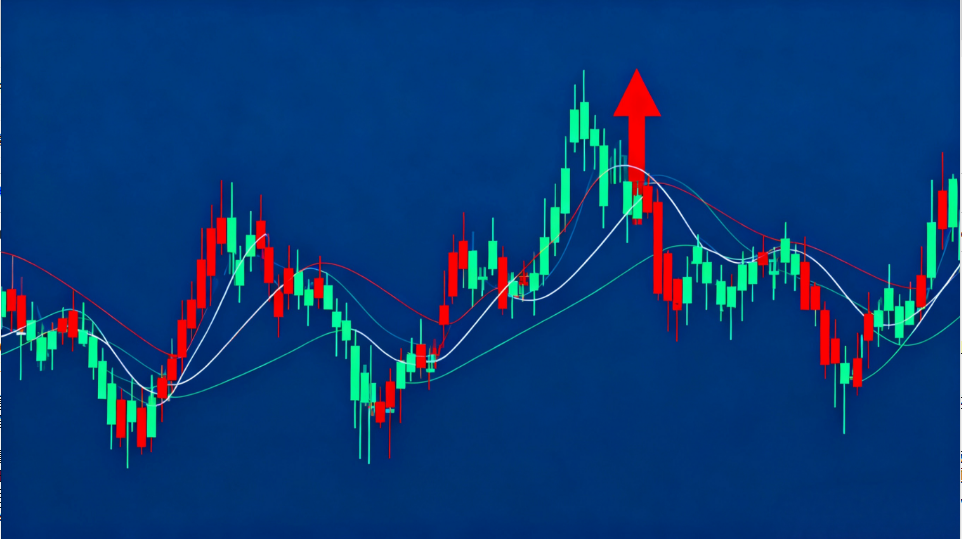
The recent weak U.S. employment report has indeed strengthened expectations for a Fed rate cut, which should have been positive for risk assets. However, Bitcoin is still oscillating around $112,000, struggling to break through the $120,000 mark. Multiple analysts point out that although technical indicators show a short-term bullish trend for Bitcoin, extremely low trading volume has created a significant divergence between volume and price, limiting the possibility of further breakthroughs.
Market Digests Dovish Expectations
In traditional logic, a Fed rate cut should inject more liquidity into the market, making investors more inclined to put funds into risk assets like Bitcoin. Historical data shows that Bitcoin usually rises before loose policies are implemented.
However, CryptoQuant analysts note that based on predictions from a deep learning model, Bitcoin may remain in a range of $108,000 to $120,000 in the short term.
The market has already priced in a certain degree of policy easing, and the benefits of a rate cut may have been prematurely exhausted. As was the case in 2019, Bitcoin rose significantly before the rate-setting meeting but was sold off afterward as the reality of weak economic growth emerged.
Institutional Behavior Quietly Shifts
Recent market liquidity cooled due to the U.S. Labor Day holiday, but funds beneath the surface are not calm. Lookonchain data shows that a whale who had held Bitcoin for over five years sold approximately $4 billion worth of Bitcoin through a decentralized exchange and shifted into Ethereum.
Regarding ETF fund flows, although the net weekly inflow into spot Bitcoin ETFs has exceeded $2 billion, confirming Bitcoin as an institutional-grade asset, ETF inflows have slowed significantly since late August.
Corporate balance sheet buying, once a sustained positive factor, has also begun to weaken. These changes make the September rate cut a conditional trigger for market movement rather than a direct catalyst.
Key Technical Resistance Analysis
From a technical perspective, Bitcoin is in a balanced zone between key support and resistance. $108,000 is a critical support level, while $114,000 constitutes major resistance.
Market analysts generally believe that unless Bitcoin can effectively break through and hold above $114,000, any rally may only be a short-term rebound.
The Coinglass liquidation heatmap warns that if the price falls below $107,000, approximately $390 million in long leverage would be forced to liquidate, potentially triggering a waterfall decline.
Unfavorable Historical Performance in September
Historical data also does not support a significant Bitcoin rally in September. Since 2013, Bitcoin has closed lower in 8 out of the past 12 Septembers, with an average return of approximately -3.80%.
Market veterans refer to this as the "September Effect," where traders typically lock in profits after the summer行情 or readjust their portfolios before the fourth quarter.
Particularly noteworthy is that September 8 has historically been a bearish day. Crypto analyst Timothy Peterson points out that Bitcoin has a 72% probability of closing lower on September 8, with an average decline of 1.30%.
Weakening Halving Cycle Effect
Traditionally, Bitcoin halving affects its price through four aspects: enhancing scarcity, increasing production costs, stimulating market psychological expectations, and altering supply-demand dynamics.
Historically, prices surged after halving events: after the 2012 halving, the price soared from $12 to $1,200; after the 2016 halving, from $650 to $19,000; and after the 2020 halving, from $8,500 to $69,000.
However, as Bitcoin’s institutionalization accelerates with massive inflows into U.S. spot Bitcoin ETFs, the correlation between the halving cycle and Bitcoin’s price may have weakened.
Beyond psychological, self-fulfilling prophecies, there is no fundamental reason explaining why Bitcoin must peak in Q4 2025.
Weakening Impact of Dollar Trends
A weaker U.S. dollar could have originally supported Bitcoin bulls. As the U.S. economy slows and Fed rate cut expectations rise, forex traders have turned bearish on the dollar.
However, as of recently, the 52-week correlation coefficient between Bitcoin and the U.S. Dollar Index (DXY) has dropped to -0.25, the lowest level in two years. This indicates that Bitcoin is gradually decoupling from the dollar’s movements, reducing the boosting effect of dollar weakness on Bitcoin.
Based on current market conditions, a cautious strategy is recommended. Short-term traders may consider range trading near key support and resistance levels.
Analyst ZYN predicts that Bitcoin could hit a new high exceeding $124,500 within the next 4-6 weeks. However, this requires Bitcoin to first reclaim $114,000 and hold $108,000 as support.
For long-term investors, continuing to hold Bitcoin may be a reasonable choice. Massive inflows into spot Bitcoin ETFs and potential Fed rate cuts are supportive factors.
The correlation between Bitcoin and the U.S. Dollar Index has dropped to a two-year low, meaning traditional macroeconomic factors are having a diminishing impact on cryptocurrencies.
Even if the Fed cuts rates as expected by the market, it may not be enough to push Bitcoin through the $120,000 resistance level. The market needs stronger ETF inflows or genuine liquidity expansion to break through this critical barrier.
Bitcoin is maturing, and traditional cycle patterns may no longer apply. Institutional funds, political factors (such as Trump making cryptocurrency an election issue), and structural buying now outweigh historical economic cycle influences.


