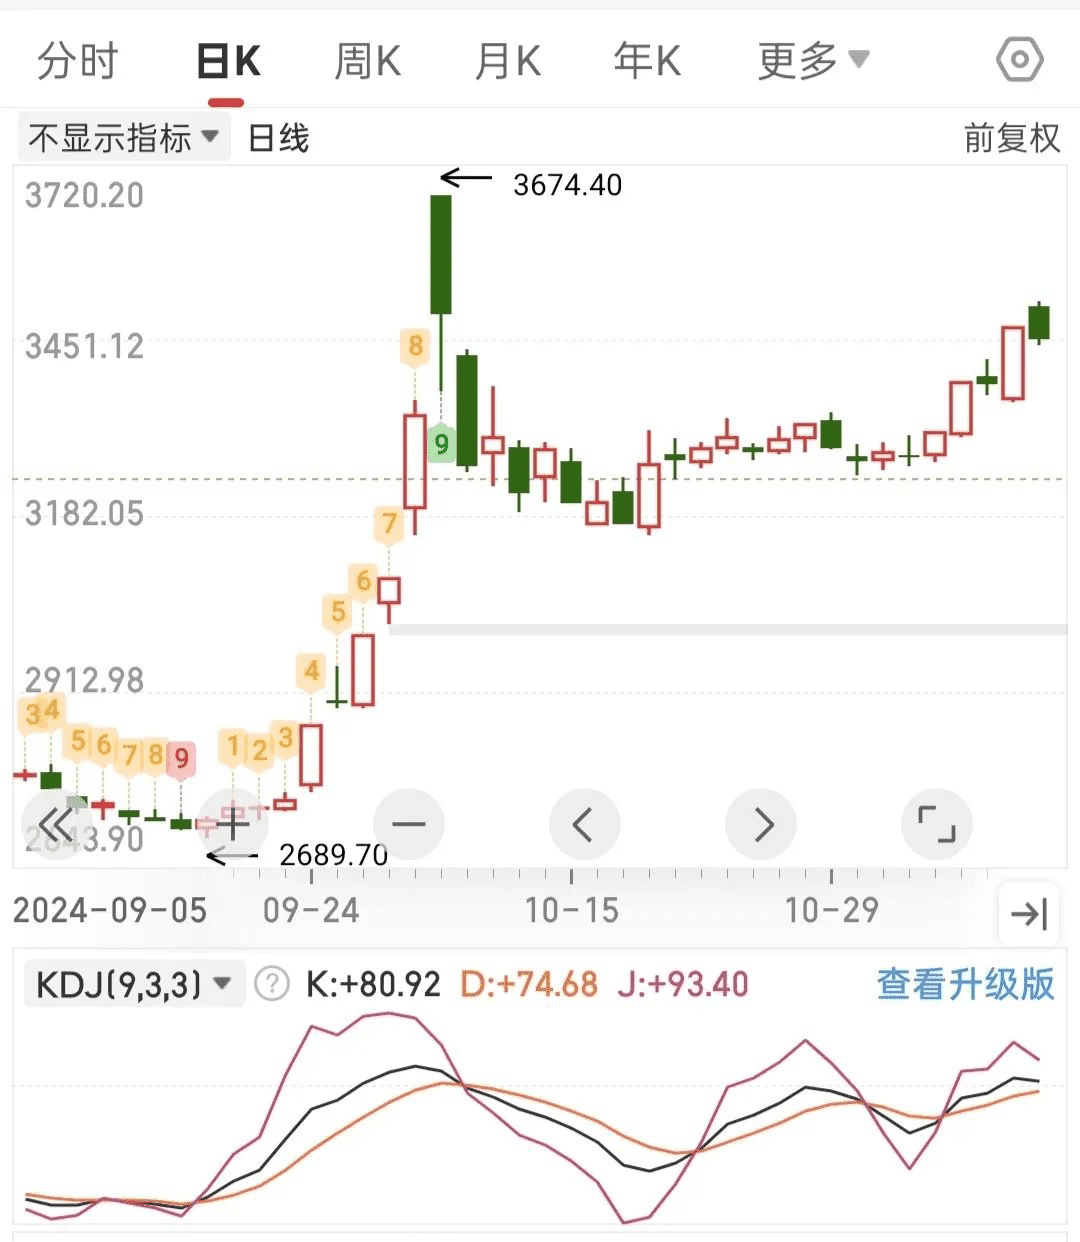
What is the KDJ Stochastic Indicator?
The KDJ indicator is a commonly used technical analysis tool, also known as the Stochastic Oscillator, which is a relatively novel and practical technical indicator.
The KDJ indicator was first developed by George Lane. Its design primarily studies the relationship among the highest price, lowest price, and closing price.

Principle of the KDJ Indicator:
The KDJ uses the highest price, lowest price, and closing price as basic data for calculation. The resulting K value, D value, and J value form points on the index coordinate. Connecting countless such points creates a KDJ indicator that fully reflects the price fluctuation trend. It mainly uses the real amplitude of price fluctuations to reflect the strength/weakness of price trends and overbought/oversold conditions, serving as a technical tool to issue trading signals before prices rise or fall.
The KDJ integrates the advantages of momentum concepts, strength indicators, and moving averages, enabling rapid and intuitive market analysis. It is widely used for short-to-medium-term trend analysis in the stock market and is one of the most commonly used technical indicators in futures and stock markets.
Meaning of KDJ Indicator:
- **K Line**: Fast confirmation line. The K value represents the relationship between the current price and the lowest/highest prices within a certain period (e.g., 9 days). A higher K value indicates a higher stock price, and vice versa. Calculated via the proportional relationship among the highest price, lowest price, and closing price, with values ranging from 0 to 100.
- **D Line**: Slow main line. The D value is a smoothed line of the K value, representing the medium-term trend, with values from 0 to 100.
- **J Line**: Direction-sensitive line. The J line is calculated from the K and D lines, used to measure market strength, with values from 0 to 100.
Indicator Applications:
1. **Overbought/Oversold Judgment**: Generally, when K and D values exceed 80, the market is overbought, and prices may correct; when K and D values are below 20, the market is oversold, and prices may rebound.
2. **Crossing Signals**: When the K line crosses the D line from below, forming a golden cross, it is a buy signal; when the K line crosses the D line from above, forming a death cross, it is a sell signal.
3. **Divergence Analysis**: When prices reach new highs but the KDJ indicator does not, a top divergence occurs, indicating a potential price reversal and decline; when prices hit new lows but the KDJ indicator does not, a bottom divergence occurs, indicating a potential price reversal and rise.


