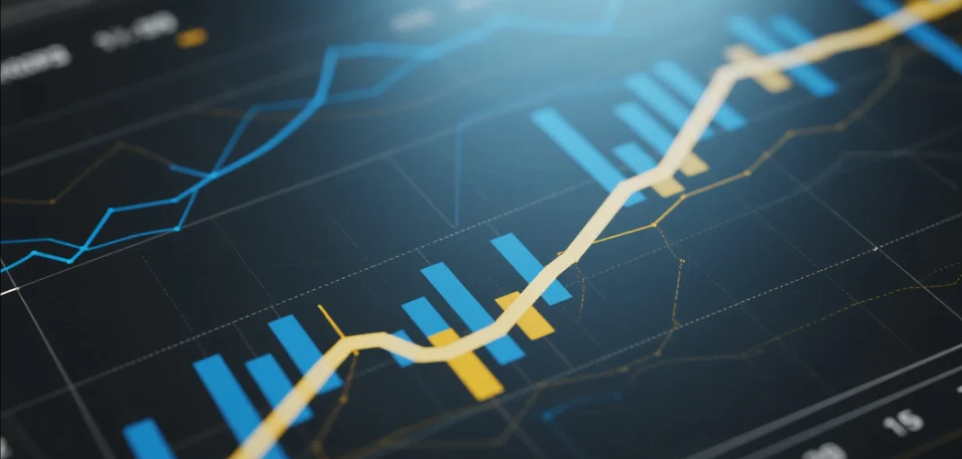


In recent years, the ETF market has developed rapidly, with the number of products growing quickly. A single index may now be tracked by multiple ETFs. For example, among broad-based indices, the newly launched CSI A50 Index is tracked by 10 ETFs, the CSI 300 Index by 22 ETFs, and the ChiNext Index and STAR 50 Index are tracked by 15 and 10 ETFs, respectively.
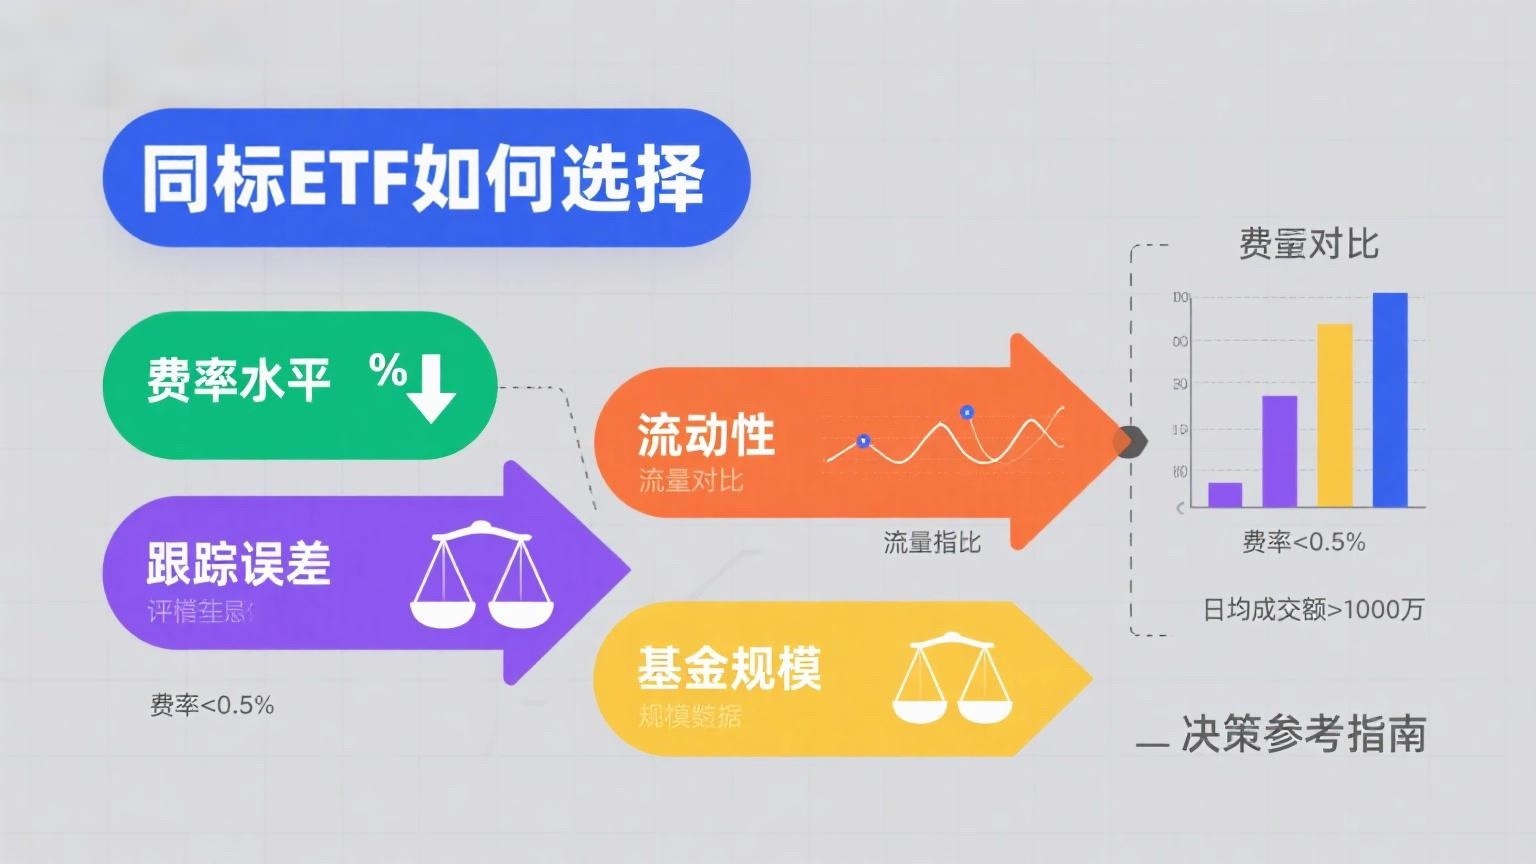
How should investors choose among ETFs tracking the same index? Should they focus on size, fees, performance, or tracking error? Don’t worry—let’s break down these key ETF metrics.
Size ≠ Liquidity: The Largest ETF Isn’t Necessarily the Most Liquid
ETF liquidity affects the convenience and cost of trading for investors. Since liquidity is somewhat correlated with fund size, many investors simply choose the largest ETF when selecting among those tracking the same index.
However, size and liquidity are not the same. For example, among the 22 ETFs tracking the CSI 300 Index, those with similar sizes do not all show identical liquidity when measured by average daily trading volume. This indicates that factors beyond size influence liquidity.
To understand these factors, let’s categorize ETF liquidity into three layers, from superficial to deep:
-
Order Book Liquidity: This is the liquidity observable through the order book in trading software, typically reflected in the bid-ask spread and the volume of orders at the top five buy and sell levels (often called "order book depth"). A smaller bid-ask spread and larger order sizes indicate better ETF liquidity and lower trading impact costs for investors.
-
Inventory Liquidity: As trading continues, orders on the book are gradually filled, and buyers and sellers must "replenish" liquidity. At this stage, liquidity depends on the trading of existing ETF shares. Until the third layer of liquidity comes into play, ETF liquidity is determined by the willingness of existing investors to sell and new investors to buy, with the upper limit being the ETF’s total outstanding shares.
-
Underlying Stock Liquidity: This stems from the unique creation/redemption mechanism of ETFs. When the first two layers (order book and inventory liquidity) cannot meet large trading demands, market makers can quickly provide ample liquidity through this mechanism. For example, if a market maker sees orders at the best ask levels (e.g., Ask 1 and Ask 2) being filled, they can promptly buy a basket of the index’s underlying stocks (based on the ETF’s daily creation/redemption list, or PCF), use these stocks to create new ETF shares, and then place these shares back on the order book to provide liquidity.
The liquidity of the underlying stocks is usually very high—sometimes exceeding RMB 1 trillion in daily trading in the A-share market—meaning underlying stock liquidity far exceeds order book and inventory liquidity. This also implies that an ETF’s liquidity and trading volume ceiling ultimately depend on the liquidity of the index’s constituents and the activity of market makers.
Thus, when selecting an ETF, investors should not just look at size but also focus on common liquidity metrics like turnover rate and trading volume. They can also check the number of market makers for an ETF on exchange websites—more market makers generally mean greater liquidity. As a rule of thumb, investors should aim for trade sizes below 30% of the ETF’s average daily trading volume over the past three months to avoid excessive impact costs.
Low Fees ≠ Good Performance: The Cheapest ETF Isn’t Necessarily the Best
There’s a saying in investing: "A penny saved is a penny earned." For ETFs tracking the same index, lower fees can provide a long-term advantage, but the cheapest option isn’t always the top performer.
Low fees typically refer to lower management and custody fees. Currently, the lowest management fee for ETFs in the market is 0.15% per year, and the lowest custody fee is 0.05% per year. These costs are part of index replication expenses—the lower the fees, the lower the holding costs for investors, and the higher the ETF’s net returns.
However, an ETF’s performance isn’t just about cost reduction ("subtraction") but also about the "addition" of active management. Fund managers can employ strategies like optimizing trades during index rebalancing, capturing IPO gains, or using derivatives to replace physical holdings. By meticulously pursuing small but relatively certain returns, they can offset index replication costs and even generate alpha beyond the benchmark.
In short, the best-performing ETFs are those that minimize costs while maximizing added value. When choosing among ETFs tracking the same index, don’t just compare fees—evaluate overall performance and select products that deliver consistent excess returns.